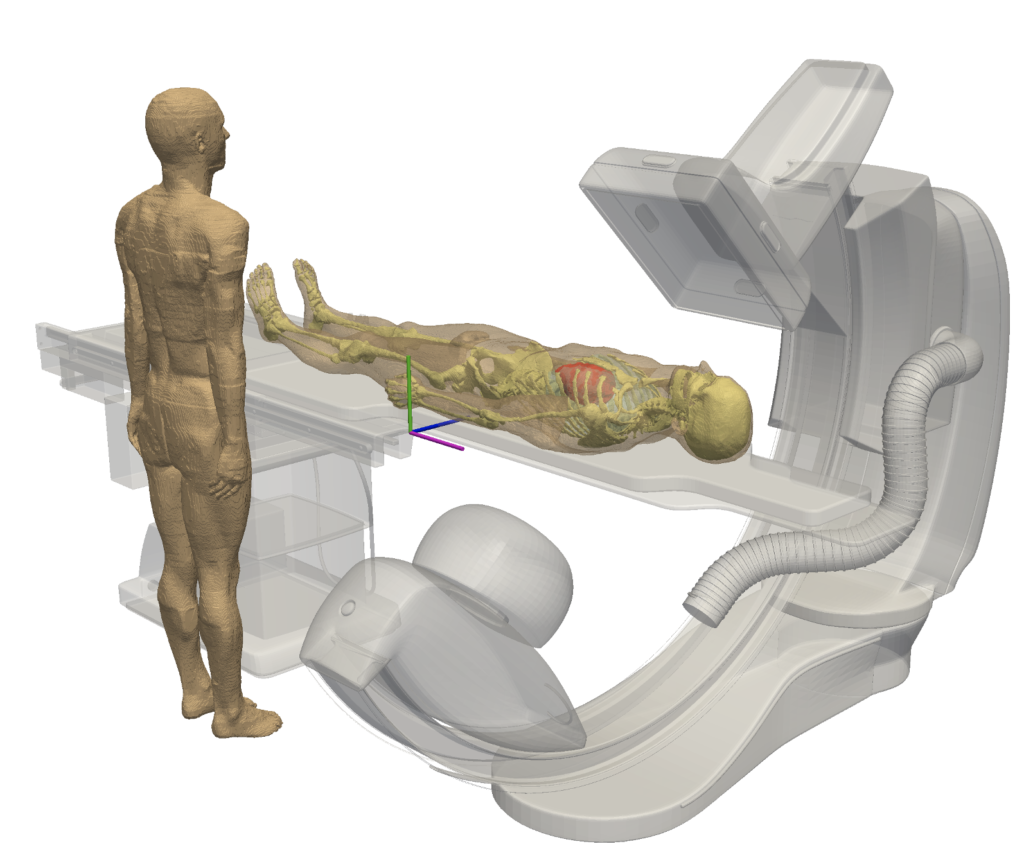
Interventional fluoroscopy is an imaging modality that provides a real-time x-ray image of a patient’s anatomy. The radiation dose delivered to patients and operators during interventional fluoroscopy procedures can be substantial, and cause radiation injuries. Dosimeter badges, the standard method used for dose estimation, measure radiation at discrete points, and the dose is only known after the procedure. With the increasing use of fluoroscopy, there is a need for new tools that can reduce the dose and minimize side effects. At CDRH/OSEL/DIDSR we are developing a Virtual Dosimeter system to estimate, computationally, the radiation delivered to operators and patients in real-time (Figure 1).
In the current project, I developed a Conductor Software tool that coordinates the execution of the 3 existing modules of the Virtual Dosimeter and created a new Display Module.
Figure 1
A computational model of an operator standing next to a patient during an interventional fluoroscopy procedure.
Results: Conductor application
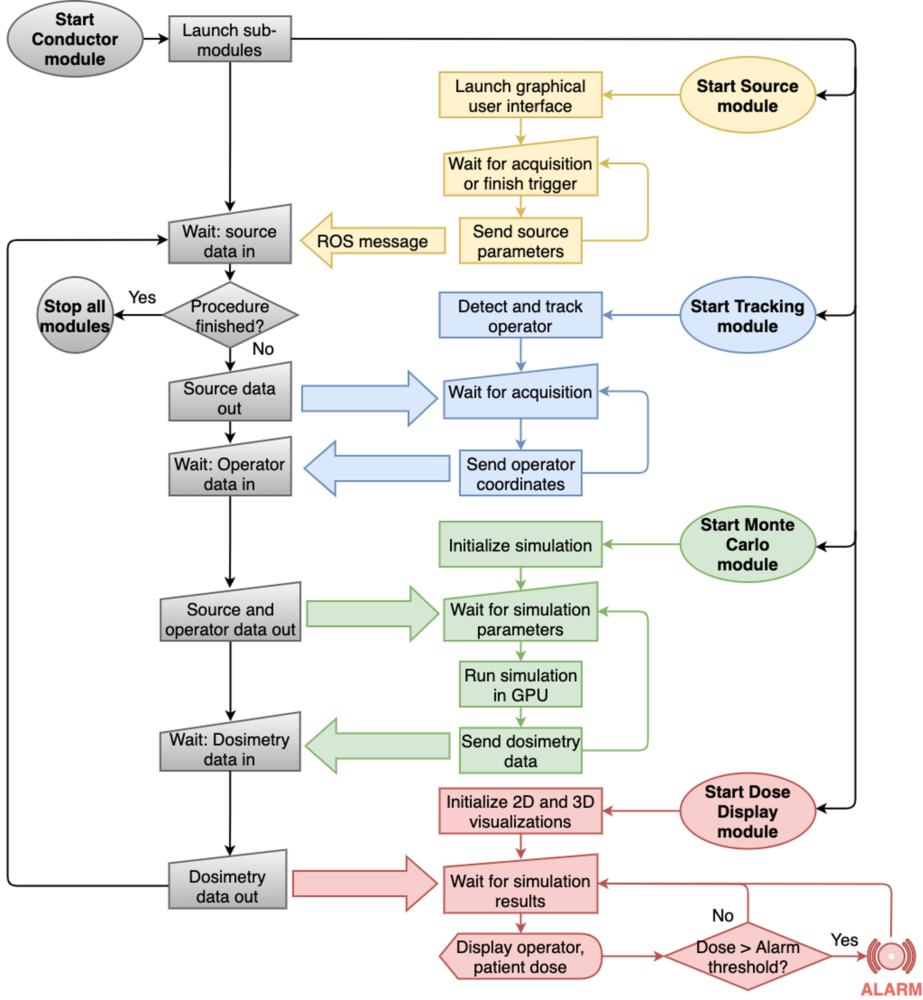
We developed a command-line application written in Python language within the Ubuntu Linux environment by using the Robot Operating System (ROS) library. We named the application, “Conductor Application” because the application is “conducting” the communication between the four different modules to eventually estimate radiation dose to medical staff undergoing interventional fluoroscopy procedures. Figure 1 shows the workflow of the Virtual Dosimeter System where the Conductor application communicates messages among the four different modules. The process follows the four steps:
Step A: Receive x-ray source data from the Source Module.
Step B: Communicate with the Tracking Module to receive the operator position at the time of the irradiation.
Step C: Send source and operator data to Monte Carlo Module for fast x-ray transport simulation using MC-GPU and receive the estimated organ and skin doses.
Step D: Send dosimetry results to the Display Module to inform the operator of the received radiation exposure.
The Conductor application was designed to repeat the process described above for each acquisition in the procedure.
Figure 2
Flow chart of the Virtual Dosimetry system where the ROS messages are exchanged between modules using the new Conductor application: Source Module, Tracking Module, Monte Carlo Module, and Dose Display Module.
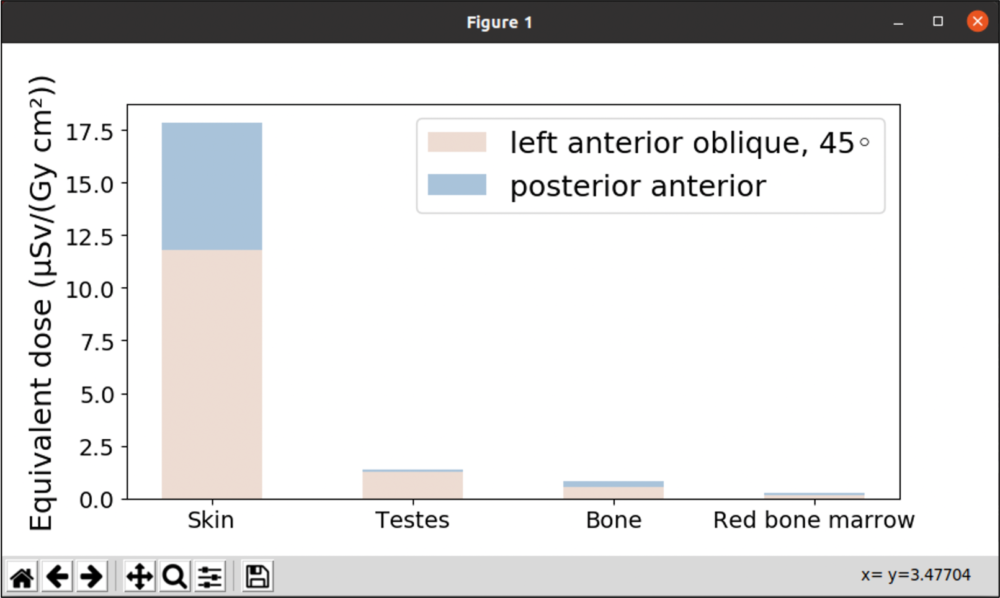
Results: Illustrative dose to operator
We estimated illustrative doses using the Virtual Dosimeter system running through the Conductor application. Display Module was used to display dose results in two different modes: organ dose in bar graphs and dose distribution map.
Figure 3 shows the bar graph of doses to the skin, testes, bone, and red bone marrow received by the operator for two different fluoroscopic procedures: left anterior oblique 45 degree and posterior anterior views. The organ doses were calculated by Monte Carlo Module based on the input data from Source Module and Tracking Module. Skin received a substantially greater dose compared to other organs in both procedures.
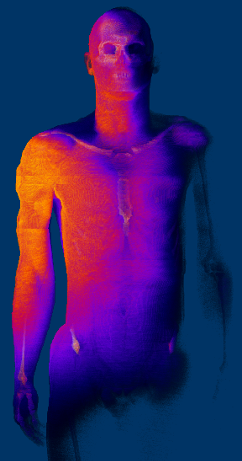
Figure 4 shows the illustrative dose distribution throughout the anatomy of the operator conducting the left anterior oblique 45-degree procedure for a patient. The high dose is focused on the right shoulder region of the operator.
Figure 3. Bar graph of computed operator organ doses in two fluoroscopy views generated by the Display module.
Figure 4. Illustrative radiation dose distribution delivered to an operator conducting the left anterior oblique 45 degree procedure.
Conclusion and Future Work
We developed the Conductor application to manage communication between multiple modules within the Virtual Dosimeter system using the popular, open-source Robot Operating System library. In the future, a volume renderer for the Display Module will be developed and an alarm to warn operators of potential overexposures will be implemented into the system.